KODEX 200 vs KODEX 200 Target Weekly Covered Call: A Comparative Analysis of 1-Year Returns (Including Dividends)

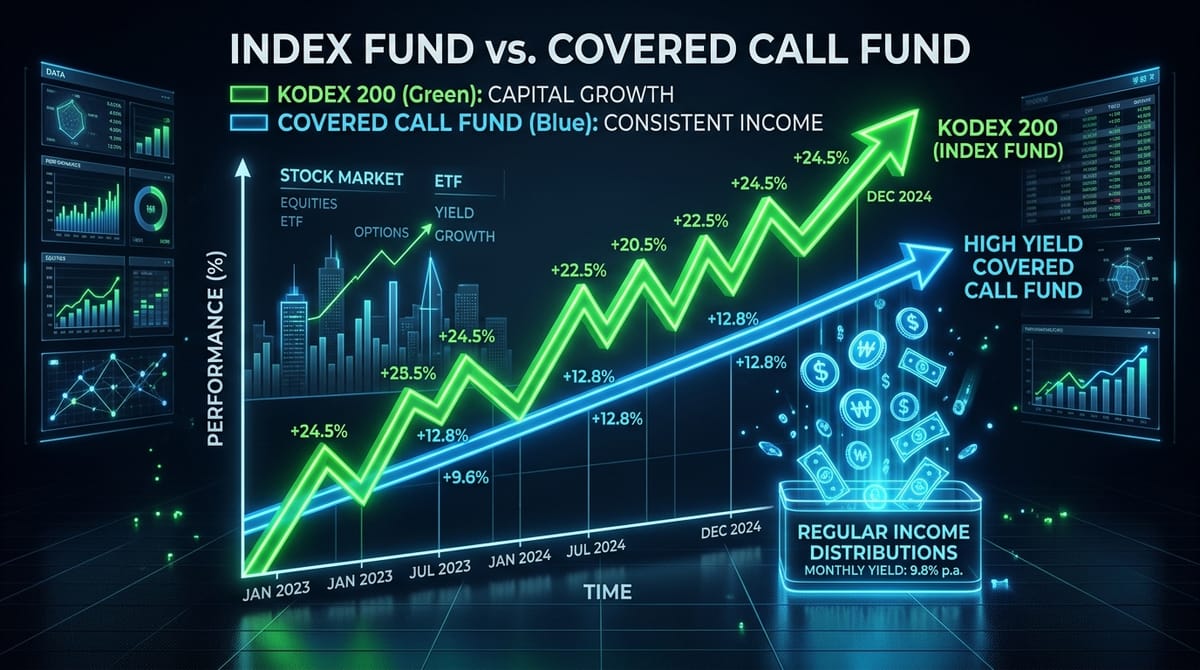
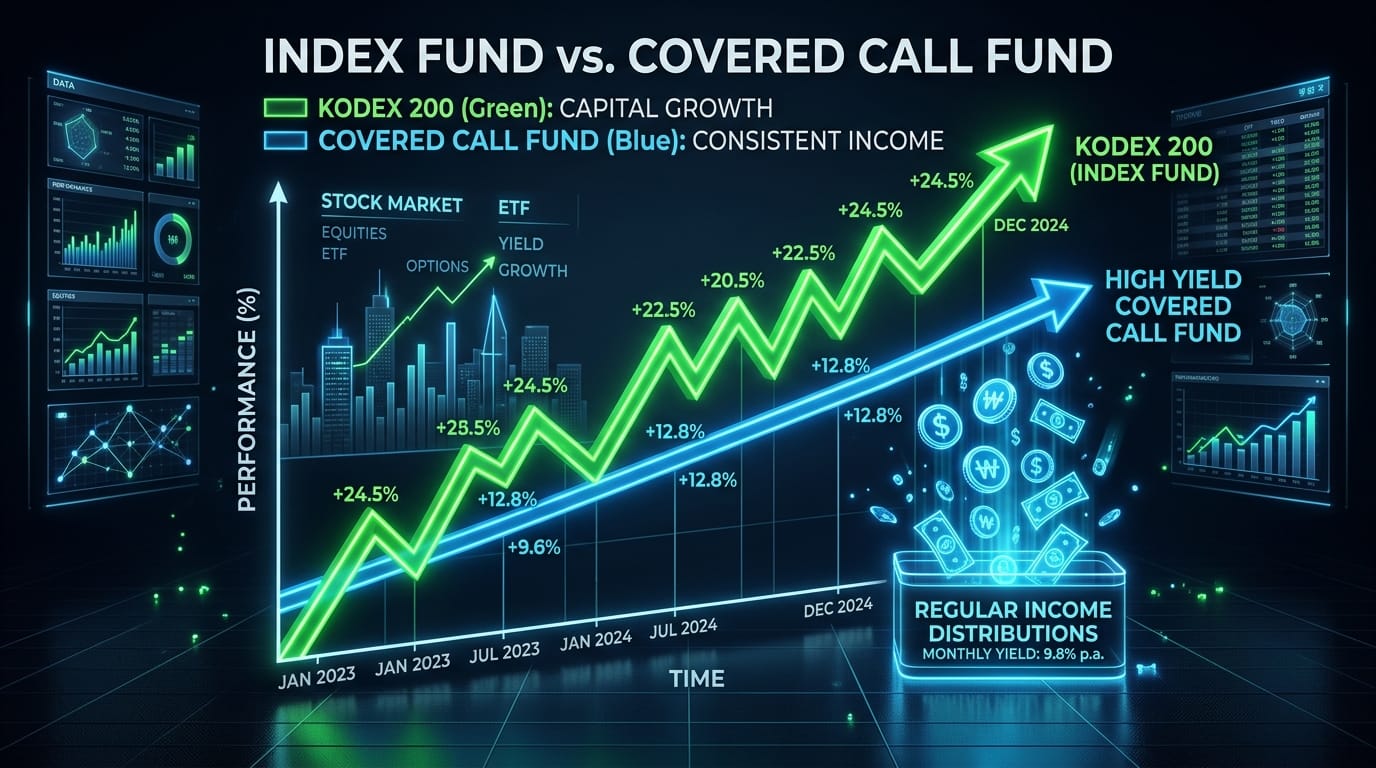
KODEX 200 vs KODEX 200 Target Weekly Covered Call 1-Year Performance Comparison
Over the past year, the Korean stock market has shown a very strong upward trend, driven by improvements in the semiconductor industry and explosive demand for AI hardware.
We analyze in detail which ETF achieved a superior final total return (including dividends/distributions) between KODEX 200 (069500), a representative Korean Stock ETF that tracks 100% of the index, and KODEX 200 Target Weekly Covered Call (498400), which is designed to target a monthly dividend cash flow of around 15% per year.
📊 1. Summary of Baseline Data (July 2025 ~ July 2026)
This data aggregates the stock prices on the base date of comparison and the cumulative distributions paid during that period.
| Item | KODEX 200 Target Weekly Covered Call (498400) | KODEX 200 (069500) |
|---|---|---|
| 2025-07-03 Closing Price (Base) | 9,425 KRW | 41,988 KRW |
| 2026-07-03 Closing Price (Ending) | 25,320 KRW | 131,010 KRW |
| Price Fluctuation in Period | +15,895 KRW (+168.65%) | +89,022 KRW (+211.96%) |
| Cumulative Distribution (Past 1 Year) | 2,718 KRW (Distribution Rate: 28.84%) | 842 KRW (Dividend Yield: 2.01%) |
📈 2. 1-Year Total Return Comparison (Including Dividends/Distributions)
This comparison is based on the Simple Total Return, which adds the total amount of distributions received during the period to the capital gains.
| Analysis Metrics | KODEX 200 Target Weekly Covered Call | KODEX 200 |
|---|---|---|
| Capital Gains Return | +168.65% | +211.96% |
| Distribution (Dividend) Return | +28.84% | +2.01% |
| Total Final Return | +197.49% | +214.02% |
💡 Key Performance Analysis
- Profit limits in a rising market (Underperformance):
In a bull market where the KOSPI index surges rapidly like it did over the past year, KODEX 200 (+214.02%) outperformed the Weekly Covered Call (+197.49%) by +16.53%p. - Cap effect on covered calls:
Although KODEX 200 Target Weekly Covered Call offered a massive monthly high dividend cash flow of 2,718 KRW (28.84% distribution rate), its capital gain potential was capped due to the selling of call options in a rising market. As a result, it fell short of catching up with the raw index growth, even with distributions included.
📅 3. Cumulative Performance Comparison Since Listing (Dec 03, 2024 ~ July 03, 2026)
This shows the long-term cumulative performance for approximately 1 year and 7 months since the listing of KODEX 200 Target Weekly Covered Call (December 3, 2024).
| Analysis Metrics | KODEX 200 Target Weekly Covered Call | KODEX 200 |
|---|---|---|
| Stock Price Appreciation Since Listing | +231.72% (7,633 KRW ➔ 25,320 KRW) | +304.18% (32,414 KRW ➔ 131,010 KRW) |
| Cumulative Distribution | 3,623 KRW (Distribution Rate: 47.46%) | 1,381 KRW (Dividend Yield: 4.26%) |
| Cumulative Final Return | +279.18% | +308.44% |
As the super bull market rally continued even in the long-term trend since listing, KODEX 200—the simple index-tracking fund—took a clear lead by about 29.26%p, dominating in terms of asset growth.
📝 4. Key Takeaways for Investors
- Index ETFs win in a bull market:
For growth-oriented or long-term regular savings plan investors who need to compound assets rapidly, standard index-tracking ETFs (KODEX 200) are far superior to covered calls. - Value shines in sideways and down markets:
If the index enters a sideways range (box pattern) or a mild bear market, the option premium distributions of covered calls—which exceed 1% monthly—will act as excellent downside protection and loss buffer, outperforming index ETFs. - Selection criteria by investment objective:
- Personal pension and retirees (income needs) ➔ KODEX 200 Target Weekly Covered Call
- Asset growth focused (RSP/long-term investing) ➔ KODEX 200
This analysis report was automatically generated by the AI trading system BroBot, based on real-time market prices and public distribution data.
⚠️ Disclaimer
* The content in this post is for analysis and educational purposes only, and under no circumstances constitutes an investment solicitation or recommendation for specific financial products.
* While this information has been compiled based on reliable sources, its accuracy and completeness cannot be guaranteed, and is subject to change without notice due to market conditions or system changes.
* All investment decisions must be made under the investor's own judgment and responsibility, and under no circumstances shall this information serve as a legal basis for the investor's final decision.